Node labels for Node Exporter alerts
Running a multipurpose Kubernetes cluster where production, dev and infra workloads share the same infrastructure is pretty common. In such a setup, you often want your alerting rules to be smarter: fire a critical alert when a prod node is burning CPU, but keep it informational for a dev node. To do that, you need your Prometheus metrics to carry environment context. This post shows how to thread that label all the way from a Karpenter node pool down to the Prometheus alert.
There are three pieces to wire together: node labels defined in Karpenter, label propagation to pods via Kyverno, and relabeling rules in the node exporter service monitor.
1 - Karpenter NodePool: labeling the nodes Link to heading
The starting point is the node itself. Karpenter NodePool resources have a template.metadata.labels section where you can attach arbitrary labels to every node that the pool provisions:
apiVersion: karpenter.sh/v1
kind: NodePool
metadata:
  name: prod
spec:
  template:
    metadata:
      labels:
        env: prod
    spec:
      ...
Repeat the same for dev, infra, or any other environment slices you have. From this moment, every node that Karpenter spawns from a given pool carries the env label. You can verify it with:
kubectl get nodes -o custom-columns='NAME:.metadata.name,ENV:.metadata.labels.env'

NAME                                                 ENV
ip-10-2-56-30.eu-south-2.compute.internal            dev
ip-10-2-62-228.eu-south-2.compute.internal           prod
2 - Kyverno ClusterPolicy: propagating node labels to Node Exporter pods Link to heading
Node labels are great, but prometheus-node-exporter runs as pods, and pods don’t automatically inherit node labels. Here’s where Kyverno fills the gap. A mutating ClusterPolicy can intercept pod creation and stamp the relevant node labels directly onto the pod metadata:
apiVersion: kyverno.io/v1
kind: ClusterPolicy
metadata:
  name: propagate-node-labels
spec:
  rules:
    - name: copy-node-labels
      match:
        any:
          - resources:
              kinds:
                - Pod
      context:
        - name: nodeLabels
          apiCall:
            urlPath: "/api/v1/nodes/{{ request.object.spec.nodeName }}/labels"
            jmesPath: "metadata.labels"
      mutate:
        patchStrategicMerge:
          metadata:
            labels:
              env: '{{ nodeLabels.env }}'
              karpenter.sh/capacity-type: '{{ nodeLabels."karpenter.sh/capacity-type" }}'
              karpenter.sh/nodepool: '{{ nodeLabels."karpenter.sh/nodepool" }}'
              kubernetes.io/arch: '{{ nodeLabels."kubernetes.io/arch" }}'
              topology.kubernetes.io/zone: '{{ nodeLabels."topology.kubernetes.io/zone" }}'
        targets:
          - apiVersion: v1
            kind: Pod
            name: '{{ request.object.metadata.name }}'
            namespace: '{{ request.object.metadata.namespace }}'
The context block performs an API call to fetch the labels of the node where the pod is being scheduled, and then the mutate section patches those values right into the pod labels. Notice that labels with slashes in their names (like karpenter.sh/nodepool) require quoting inside the JMESPath expression.
Note: Kyverno only mutates pods at admission time, so existing node-exporter pods won’t be affected retroactively. Once the policy is applied, you need to restart the node-exporter DaemonSet to trigger pod recreation and get the labels attached:
kubectl rollout restart daemonset -n monitoring prometheus-node-exporter
Once the policy is in place, verify the labels landed correctly:
kubectl get pods -n monitoring -l app.kubernetes.io/name=prometheus-node-exporter \
  -o jsonpath='{range .items[*]}{.metadata.name}{"\t"}{.metadata.labels.env}{"\n"}{end}'
3 - kube-prometheus-stack: relabeling rules for the service monitor Link to heading
Having the labels on the pod is only half the story. Prometheus scrapes the node exporter via a ServiceMonitor, and by default pod labels are not automatically promoted to metric labels. You need explicit relabeling rules. In the kube-prometheus-stack Helm values:
prometheus-node-exporter:
  prometheus:
    monitor:
      relabelings:
      - sourceLabels: [__meta_kubernetes_endpoint_node_name]
        action: replace
        targetLabel: nodename
      - sourceLabels: [__meta_kubernetes_pod_label_env]
        action: replace
        targetLabel: env
      - sourceLabels: [__meta_kubernetes_pod_label_karpenter_sh_nodepool]
        action: replace
        targetLabel: nodepool
      - sourceLabels: [__meta_kubernetes_pod_label_karpenter_sh_capacity_type]
        action: replace
        targetLabel: capacity_type
The Prometheus service discovery meta-labels follow a predictable pattern: slashes and dashes in label names are replaced with underscores, and the whole thing is prefixed with __meta_kubernetes_pod_label_. The targetLabel is what actually shows up on your time series.
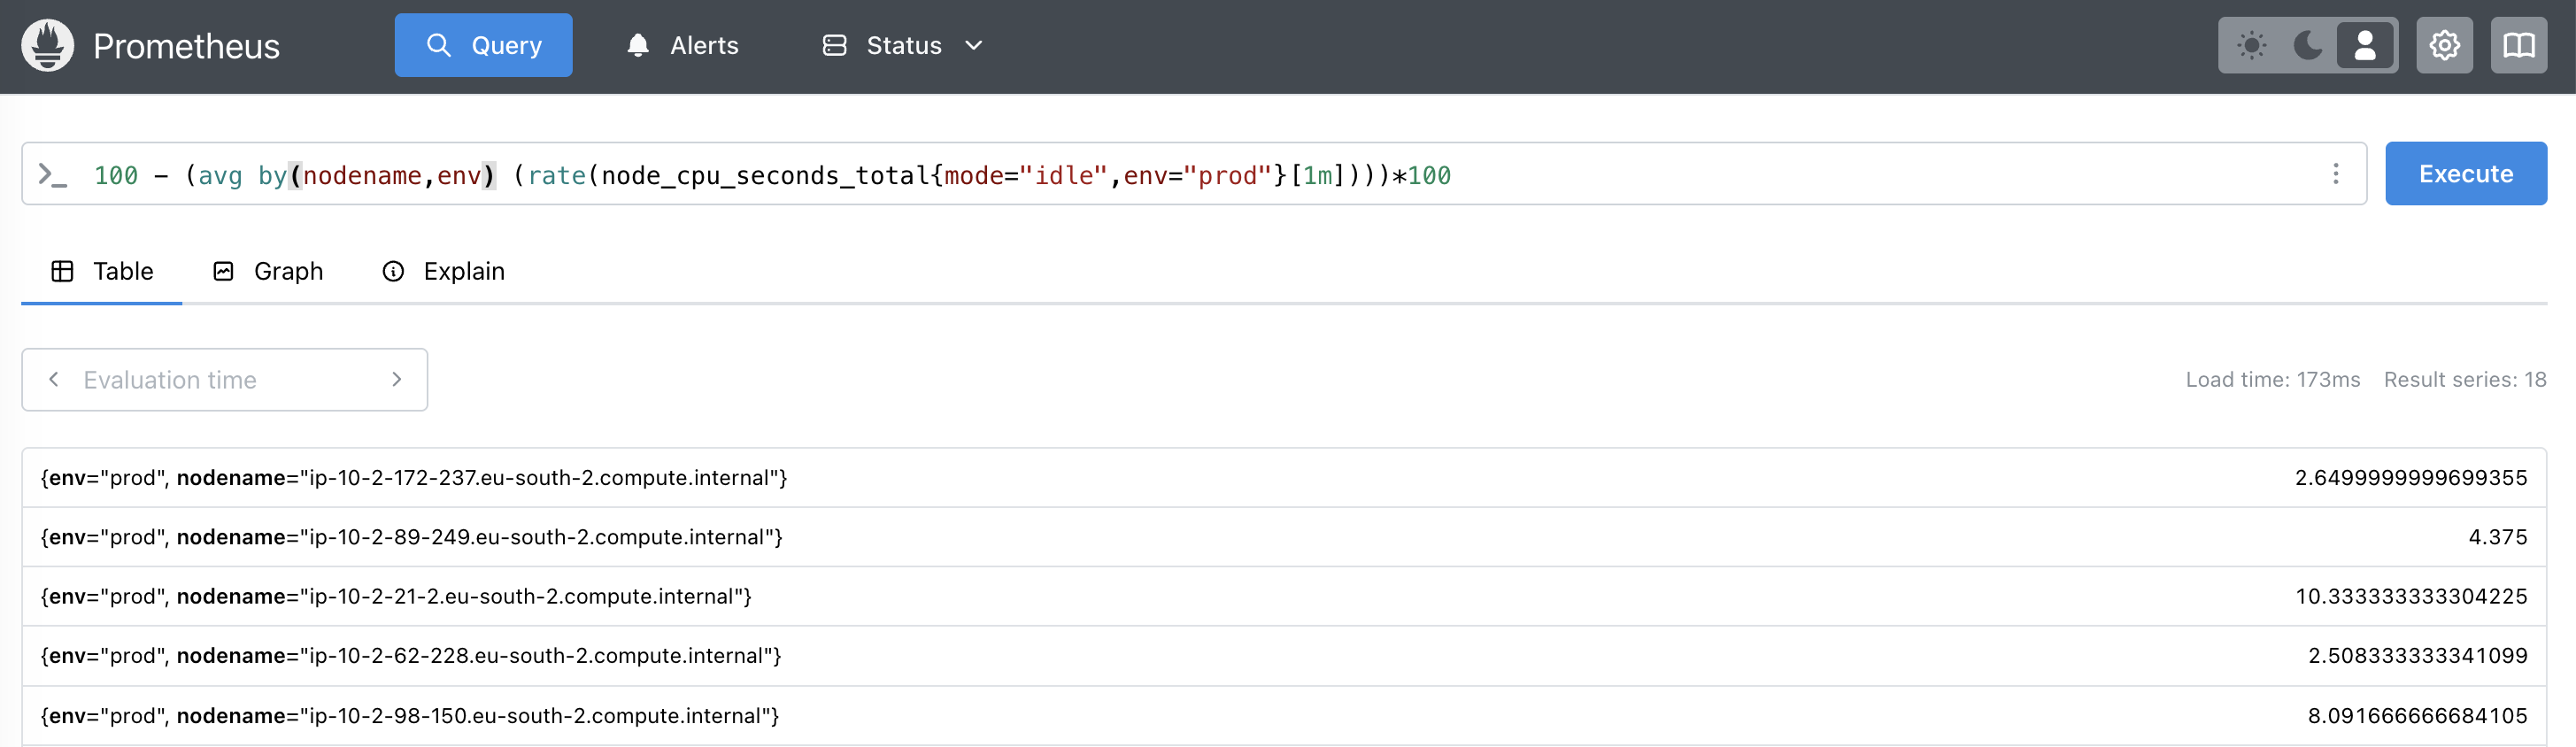
Upgrade the stack, wait for the scrape cycle, and confirm the labels appear on node_cpu_seconds_total metric:
Alerts that know the difference Link to heading
With env attached to every node-exporter metric, you can now write alert rules that behave differently per environment:
- alert: HostHighCpuLoadPROD
  expr: 100 - (avg by(nodename,env,nodepool) (rate(node_cpu_seconds_total{mode="idle",env="prod"}[1m])) * 100) > 80
  for: 1m
  labels:
    severity: critical
  annotations:
    description: "Overall PROD node CPU load is > 80% for the last minute"

- alert: HostHighCpuLoadDEV
  expr: 100 - (avg by(nodename,env,nodepool) (rate(node_cpu_seconds_total{mode="idle",env="dev"}[1m])) * 100) > 80
  for: 15m
  labels:
    severity: info
  annotations:
    description: "Overall DEV node CPU load is > 80% for the last 15 minutes"

- alert: HostHighCpuLoadINFRA
  expr: 100 - (avg by(nodename,env,nodepool) (rate(node_cpu_seconds_total{mode="idle",env="infra"}[5m])) * 100) > 80
  for: 5m
  labels:
    severity: warning
  annotations:
    description: "Overall INFRA node CPU load is > 80% for the last 5 minutes"
Same metric, same query shape — but PROD pages you immediately, DEV just logs an info event after 15 minutes, and INFRA sits somewhere in between. This is especially valuable when a single Prometheus instance monitors a cluster that spans multiple environments and node pools, since you avoid the maintenance overhead of running separate monitoring stacks per environment.
The chain is straightforward once you see it end-to-end: Karpenter stamps the node, Kyverno copies it to the pod, the service monitor relabels it into the metric. Each piece does one thing, and together they give your alerting the context it needs.
Cheers!